- 3 Minutes Wednesdays
- Posts
- 3MW (Use {ggirafe} with Shiny and trigger custom events)
3MW (Use {ggirafe} with Shiny and trigger custom events)
Guten Tag!
Many greetings from Ulm, Germany.
I have an exciting announcement for you: 3MW gets a premium subscription. Starting next week, those of you who support me with a subscription will get bonus content each week (effectively turning 3MW into 5MW).
Today, everyone will get a sneak peak of the premium content. Next week. the bonus features will be for subscribers only. If you like what you read, you can upgrade your subscription here.
Last week, we’ve learned how to create interactive plots with {ggiraph}. That’s cool, I know. But did you know that {ggiraph} also has excellent support for {shiny}? Let’s take a look. As always, the free code can be found on GitHub.
Insert {ggiraph} plot into Shiny
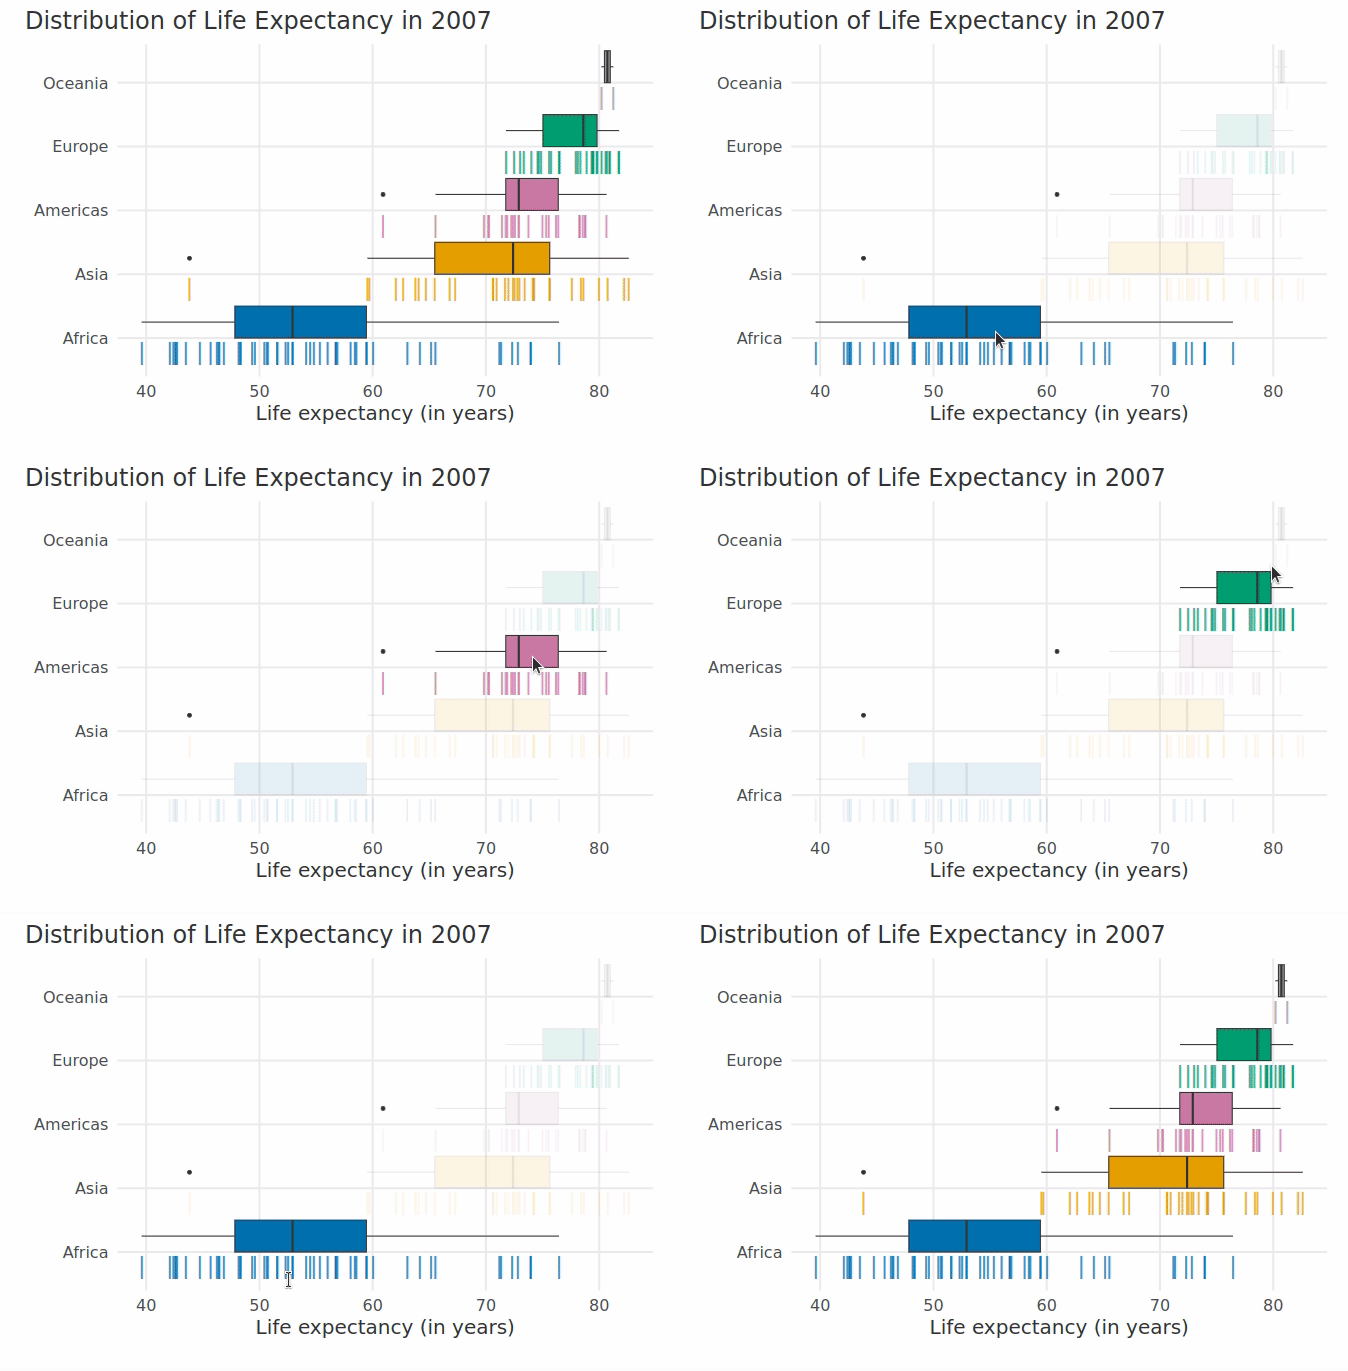
It is super simple to combine {shiny} and {ggiraph}. All you have to do is to drop a girafeOutput() in the UI and a renderGirafe() in the server function. For example, take this interactive plot from last week.

To embed this into a Shiny app, all we have to do is create a basic Shiny app skeleton and throw in the output and render call. Here, we let the user choose the year that is displayed in the plot.

This will create the following app:

Use {ggiraph} plot variables
Next, let’s add UI elements as the user interacts with the plot. This is possible using a whole bunch of variables that are created with any girafeOutput(). For example, for girafeOutput(outputId = ‘my_plot’) we can automatically use the following input values (id + keyword):
input$my_plot_selected: Displays IDs of selected plot elementsinput$my_plot_key_selected: Same but for legend elementsinput$my_plot_theme_selected: Same but for theme elements
We could use this to let the user select points from the plot and display the underlying data in a table in return.

Here, we just added a gt_output() and render_gt() to our app. And in order to access the correct rows from our data set I simply used input$girafe_output_selected.

Notice that I mapped data_id to the row numbers of the data set. Combining this with parse_number() allowed me to extract the correct rows from the data in order to display the table.
Trigger actions with onclick
Next, let us trigger an action by mapping JS code to the onclick aesthetic. Since you’re may not be that familar with JS (like me), let us do something simple. We could open up the Wikipedia page of a continent when a user clicks on the corresponding boxplot.
The JS code for that is just one line. Call window.open() and insert a valid URL into the parentheses. With R’s glue() function it’s really easy to assemble the correct URL.

That’s all the code you have to change in the previous app. Check it out:

This concludes this week’s 3MW. Read on for a sneak peek of 5MW.
Use onclick with R instead of JS code
Technically, you don’t need to use Shiny for onclick. But with Shiny you can use onclick to trigger actions that use R code (as opposed to JS).
The trick is to use a tiny bit of JS to change the value of one of Shiny’s reactive variables. Once that variable is changed, we can trigger R code based on that.

This code does two things after a click on a boxplot:
It sets the variable
input$last_clickto an empty string andupdates the same variable with name of the boxplot’s continent
We can use that to our advantage. For example, we could observe input$last_click, track changes to that variable in a vector and display them in the app. And we could do something similar with input$girafe_output_selected.

Notice that the second list shows only the current selection. Implementing the same list without onclick is much more complicated.
The full code for this week’s premium content can be found on GitHub.
That’s a wrap. If you enjoyed the premium version of this newsletter and want to support my work, sign up here.
See you next time!
Albert 👋
Reply